VSCode Debugging
This is a guide on how to perform remote debugging via JTAG in Tock using VSCode (at the moment (Feb 2018) nRF51-DK and nRF52-DK are supported).
Requirements
Installation
- Install VSCode for your platform
- Open VSCode
- Enter the extensions menu by pressing
View/Extensions - Install
Native DebugandRustin that view by searching for them
You are now good to run the debugger and the debugging configurations are already set for you. But, if you want change the configuration, for example to run some special GDB commands before starting, you can do that here.
Enabling breakpoints
Let's now test if this works by configuring some breakpoints:
-
Enter
Explorer modeby pressingView/Explorer -
Browse and open a file where you want to enable a breakpoint
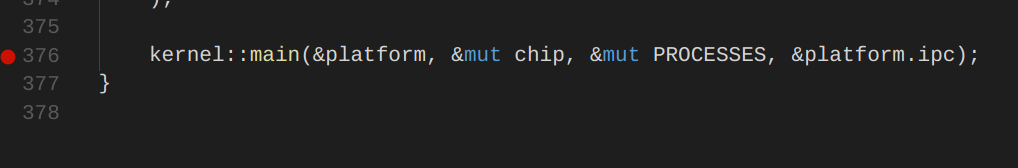
-
In my case I want to have a breakpoint in the
mainin main.rs -
Click to the left of the line number to enable a breakpoint. You should see a red dot now as the figure below:
Running the debugger
-
You need to start the
GDB Serverbefore launching a debugging session in VSCode (check out the instructions for how to do that for your board). -
Enter
Debug modein VSCode by pressingView/Debug. You should now see a debug view somewhere on your screen as in the figure below: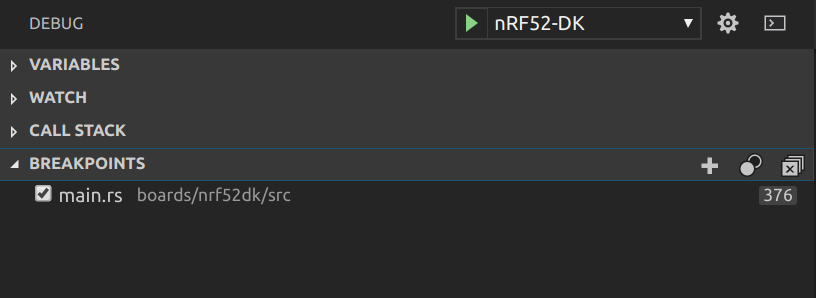
-
Choose your board in the scroll bar and then click on the green arrow or
Debug/Start Debugging. -
You should now see that program stopped at the breakpoint as the figure below:
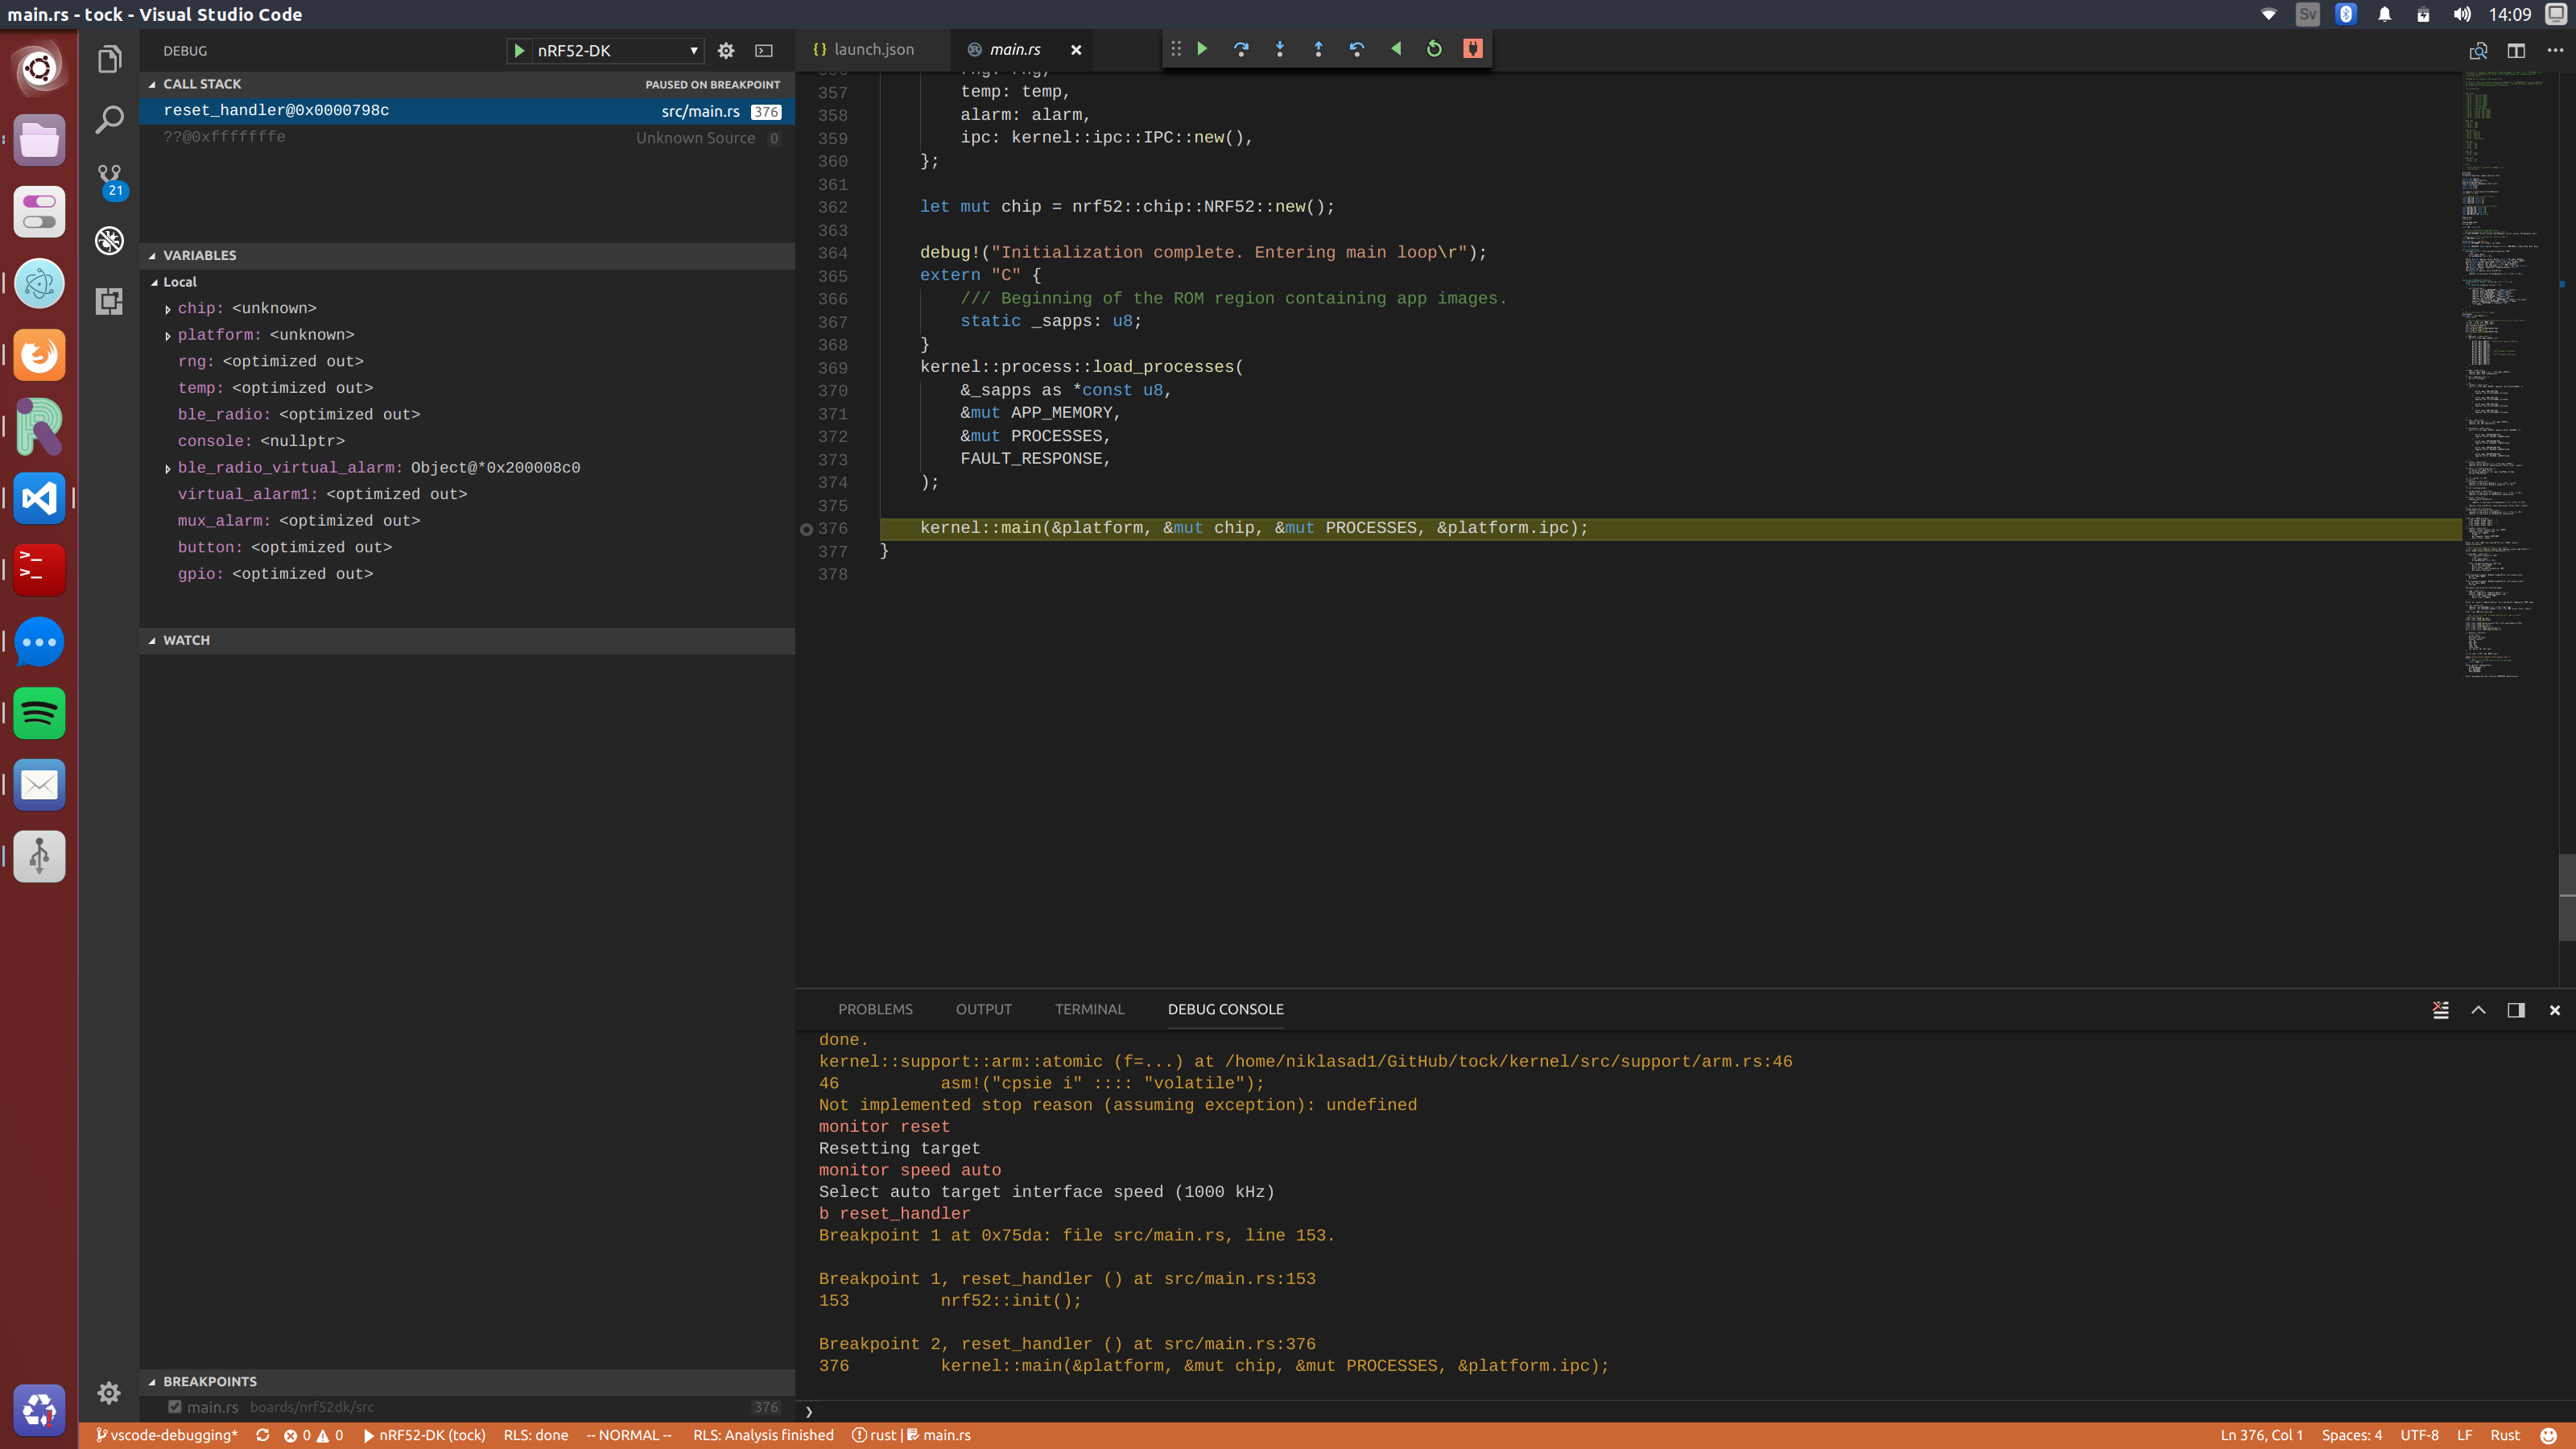
-
Finally, if want to use specific GDB commands you can use the debug console in VSCode which is very useful.
Issues
-
Sometimes GDB behaves unpredictably and stops at the wrong source line. For example, sometimes we have noticed that debugger stops at
/kernel/src/support/arm.rsinstead of themain. If that occurs just pressstep overand it should hopefully jump to correct location. -
Rust in
release modeis optimizing using things such as inlining and mangling which makes debugging harder and values may not be visible. To perform more reliable debugging mark the important functions with:#[no_mangle] #[inline(never)] -
Enable
rust-pretty printeror something similar because viewing variables is very limited in VSCode.